FEAR & GREED INDEX 44
Weekly Update
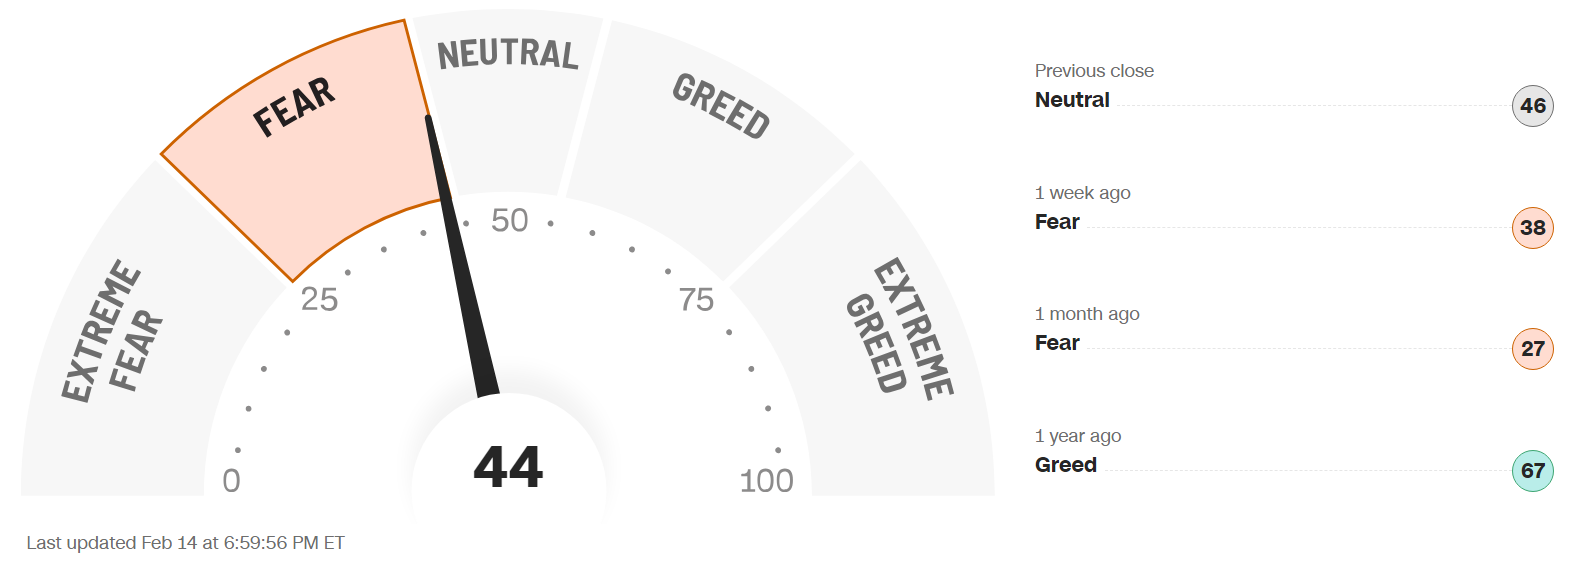
The Fear & Greed Index (found on cnn.com) is one of the easiest indicators to use to determine current market emotion. This simple to read gauge, highlighted in our publication When to Buy and When to Sell: Combining Easy Indicators, Charts, and Financial Astrology (available on Amazon), is measured in a range from 0-100, and currently reads 44 as of the close on Friday, February 14, 2025.
This figure moved up from the mid-range to the upper edge of the Fear level, as it rose 5 points from last Friday’s close of 39. The S&P 500 also gained, rising about 89 points from 6,025 to 6,114, just a few points shy of its January 23rd All-Time High. Other major indices, including the Dow Jones Industrial Average and the Nasdaq are now hovering around all-time highs as well, though the Russell 2000 small cap index fell slightly amid another volatile week.
The “Risk-On” sentiment improved by weeks end, as commodities reversed downward on Friday, after also reaching all-time highs mid-week. 10-year bond yields also decreased slightly, from 4.5%, to 4.48%, after a high of 4.61 on Wednesday. The move higher on Thursday and into Friday, especially on the Nasdaq, was curious as the comments during the FOMC meeting on Wednesday were once again conflicting regarding potential future rate cuts.
The 7 internal factors used to formulate this index are listed below:
Market Momentum – (S&P 500 vs its 125-day moving avg) = NEUTRAL
Market Volatility (measured by the VIX) = NEUTRAL
Put to Call Ratio 5-day avg. (# of Puts (bearish) vs Calls (bullish) = GREED
Stock Price Strength (# of new 52-week highs vs new 52-week lows) = FEAR
Stock Price Breadth (# of shares rising vs falling on NYSE) = FEAR
Safe-Haven Demand (which measures stocks vs bonds) = FEAR
Junk Bond Demand (non-govt. bond yield spread) = GREED
This week, 4 of the 7 factors changed levels, with Stock Price Strength slipping back into the Fear level with Stock Price Breadth, as market internals continue to be rather weak. The move cancelled out the recent improvement in the number of stocks participating in the current rally. Overall Market Momentum did improve to Neutral from Fear, although the momentum is being carried by a low number of stocks. As mentioned for several weeks, the signs of continued weak underlying conditions indicate that we need to be very selective with stock choice.
The VIX, measured by Market Volatility, decreased 1.7 points during the current week, settling in at 14.8, from 16.5, technically remaining in Neutral territory, after the mid-week rally, suggesting a bit less risky conditions for the time being.
This week’s major news was the CPI and PPI inflation reports, which again came in higher-than-expected Year-over-Year results (what a surprise), with a slight tick up, reaching its highest level since last July. This monthly report continues to prove that Fed Chairman Jerome Powell’s claims of inflation progress are false, and severely brings into question the reasons for the sudden rate cuts in the Fall of 2024. The constant “unexpected” theme whenever these figures move in the wrong direction is creating less confidence in his comments, and the markets appear to be paying more attention to the economic indicators. Also, as we have warned since the holiday season, retail sales activity plunged, bringing down most stocks in that sector. The reason for the positive price action, especially in the Nasdaq, after those comments, appear to be the sudden realization that future rate reductions may be likely due to renewed recession threats.
Astrologically, the Mars planetary retrograde energies remain in effect for about 1 more week. Mars’ aggressiveness, in sign of Cancer, continues to signify the “protection of the home,” evident by the determination to secure and protect the country by the new administration. Cybersecurity companies like Fortinet (FTNT), Crowdstrike (CRWD), and others in the industry showed strength with strong earnings. Mars will finally end its retrograde next weekend, but will remain in Cancer until early April. The threat of global conflict continues under this aspect, as we have discussed in recent blogs. Many “hidden truths” and “deceptive practices” continue to be uncovered this week, related to government and money (signified by Neptune and Saturn in Pisces). Pluto in Aquarius themes, which favors the “people” over “government” controls (discussed in previous Trader Transit, Planet Power, and weekly blogs), also continue to ramp up, as demonstrations and protests continued this week.
Aquarius “season” (with the Sun in that sign), will conclude this Tuesday, February 18, and will give way to Pisces season (please review our Sign Language – Pisces blog, dated 2-5-25). As noted, the sign of Aquarius signifies a “free and liberating” type of energy, which will be replaced by more confusing, delusionary, and theatrical energies. February is historically the 2nd weakest month for equities, especially the 2nd half of the month, which encompasses the beginning of Pisces season. Once again, the volatility and uncertainty are likely to continue.
The planet Venus (money), now in the sign of Aries (ruled by Mars), symbolizing more aggressive Mars energies, suggesting potentially sharper price action in either direction. The generally positive “vibe,” illusions of grandeur, and idealism of Venus in Pisces has been replaced by more aggressive energies. Aries is often associated with fast beginnings, that quickly fade, so be aware of potential false “breakouts.” Look for more possible reversals and volatility in the short term as a result. Venus Retrograde (beginning on March 1st, and remaining until April 12), is usually accompanied by a market pullback, which we will further discuss in tomorrow’s Planet Power - Venus Retrograde blog.
During this period, there will also be a “double-whammy” as the planet Mercury turns retrograde a few weeks later, which also often results in market pullbacks and/or multiple reversals. During this time frame Venus will move back and forth between Pisces and Aries until early June, which is likely to jumble the energies of both signs. Mercury will also be positioned in the sign of Pisces (starting on February 23) during its retrograde period, further confusing the clarity of market conditions. Expect more tumultuous price action through this time frame, as well as mixed communications.
Look for sectors such as financials, defense, pharmaceutical, communications, technology, gold/silver, and cryptocurrencies to continue to be in focus, again with some volatility. In the longer term, certain subsectors of the technology industry are likely to continue their advance into the future as well, including AI, robotics, quantum computing, and space development (Pluto in Aquarius, and Uranus ingress Gemini mid-2025).
Gold (ruled by the Sun), and Silver (ruled by the Moon), reached all-time highs again this week, before a sudden Friday plunge, as the “Risk-On” sentiment was ignited late week. The previous Mars transit through Cancer (from early September to early November), resulted in gains in gold, and continues to be Mars’ position through early April. As we have noted on several occasions recently, any pullback in these metals will likely be short-lived (as the dollar strength may be temporary) and they continue to be long-term buying opportunities on any pullbacks. The Gold to Silver ratio (covered in our publication) exceeded 90 again this week, indicating silver may currently be a slightly better value buy than gold, though it closed just below 90 by weeks end.
***As always, this information is not intended to be financial advice, or any specific buy or sell recommendation, but rather a guide to assist the reader in some further understanding of current economic conditions/movements in the sky, and how they can affect moods, behaviors, world events, and financial markets.