CHART CHAT
Consolidation
In this edition of Chart Chat, we will discuss the Chart Pattern known as Consolidation. As covered in Chapter 2 of our publication When to Buy and When to Sell; Combining Easy Indicators, Charts, and Financial Astrology (now available on Amazon), consolidation is a very popular pattern regularly used by investors and traders alike. This pattern suggests a brief “pause” in market direction, and “indecision” regarding market sentiment related to an index or equity, especially on a short-term basis.
Consolidation, sometimes referred to as “price discovery,” and/or “pockets of liquidity,” is a very easy pattern to recognize, works in all time frames, and allows some time for the investor or trader to contemplate their next move. In our publication we provide the basics of the pattern and variations of it, as well as several other patterns, for your general understanding.
This “recognition” assists the trader/investor in becoming more confident to act on the probabilities of a successful position/trade. Whichever trend or price move that precedes this pattern, will either continue, or reverse, based on several factors including volume, price strength, cycles, and economic data, as well as others. The probable move, without any clear reversal signals, is for the trend to continue after this period. However, as we continuously repeat, it is the response and reaction (emotion) that usually drives the market action at any given time, especially short-term.
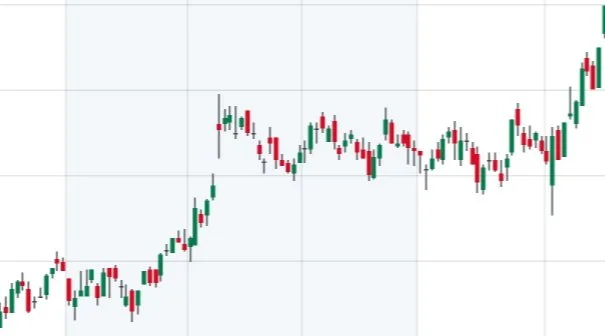
The above chart displays a perfect example of recent consolidation periods that formed during an uptrend in the price of a company named Ares Management Corp (ARES). The first “sideways” price movement occurred at the bottom left of the chart, which resulted in a “breakout” and continuation of the trend. After a second, longer, “price discovery” period, the stock again “broke out” and continued upward. Ares has been in a long uptrend, with several buying opportunities provided by consolidations.
A consolidation normally occurs between clear support and resistance lines, that form at common high and low price-pivots (reversal points). It often creates a trading “channel” where support and resistance lines are basically horizontal. A Bull Flag or Bear Flag with often form a channel opposite the direction of the trend, for a brief time, then resume the original trend.
The strength of a consolidation, or price discovery, “break-out” usually depends on three factors;
The first is the length of the consolidation, as the longer it, the stronger it is. The “build-up” time is often essential to the power of the subsequent “break.” A tighter (lower price range) consolidation is also usually stronger than a wider (larger price range) one.
The second is the number of times price “hits” the support or resistance line, as well as the time frame between these “hits.” A stock whose price repeatedly “hits” one of these lines in a short time frame is likely to “break” in that direction.
The third is the height of the range between support and resistance, as a narrow range “break” is usually stronger than a wider range “break.”
When combined with some other keys indicators, like volume, and relative strength, this pattern can be very dependable, so long as it is “confirmed.”
In future editions of Chart Chat, we will continue to provide various technical pattern education, analysis, and potential price movement set-ups.
Astrologically speaking, planet positioning and transits through the zodiac houses and signs has many similarities to technical analysis. The theme of cycles, repeating patterns, and historical data can be viewed the same way, as the probabilities can be calculated for previous percentages of success. The difference is the use of an Ephemeris, a basic calendar of future planetary transits and aspects (see Chapter 4 of our publication for details), which allows for future positions to be known, unlike the next line, bar, or candle on a technical chart. Although no source will be 100% accurate, this extra layer can be very useful. For those interested, please refer to Trader Transits and U.S. Stock Market blogs on this site, as well as the last portion of the weekly Fear & Greed Index update.
